Shining light on our trap catch history

Join us for an adventure back in time to see how our project and catch rates have grown.
Some common feedback we get from residents is that they’re keen to see what the collective trap catch effort is in their wider neighbourhood. This month, we’re highlighting the trap catch effort of our northern operating area - this areas includes Leith Valley, Pine Hill, North East Valley, Opoho and Signal Hill. This is our longest running operating area and where lots of effort has gone into aiming to get possums to 0% detection rates. A summary for each year shows just how much our residential and reserve trap line efforts have grown over the 4 years we have been trapping.
The beginning: January 2020 - December 2020
In our first project year, we had very few traps on the ground as we focused on project planning and starting our pilot site programme. We then had COVID to deal with! The first catches on Trap.NZ were from residents who were already trapping possums and rodentsin their backyards, the initiation of the trap library in North East Valley, and our first reserve traplines in Chingford Park and Ross Creek. We had a total of 59 possum traps and 96 rat traps.
Traps:
59 possum traps
96 rat traps
Catches:
154 possums
30 rats
Also 68 records of unknown species (probably rats and mice scavenged from A24 traps)
Possum catches 2020

Possum catches in our northern operating area between January - December 2020.
Rat catches 2020

Rat catches in our northern operating area between January - December 2020.
Project ramps up: January 2021 - December 2021
This year, the project really ramped up. The pilot studies in North Dunedin and Māori Hill were up and running, the City Sanctuary team grew to 3 staff and we recruited a community trapping coordinator at the Valley Project to help with residential trap installs in the northern suburbs.
As trap lines were installed across more council reserves, we saw a flurry of catches as we completed the ‘knockdown’ phase (when traps are checked frequently and placed at a high density. The red dots on the maps represent the highest number of catches at a trap. You get a good indication of where possum and rat populations are highest.
Traps:
320 possum traps
431 rat and mustelid traps
Catches:
376 possums
174 rats
Possum catches 2021

Possum catches in our northern operating area between January - December 2021.
Rat catches 2021
Rat catches in our northern operating area between January - December 2021.
Getting serious: January 2022 - December 2022
In 2022 we wanted to make sure we had every inch of target habitat in the northern operating area covered with possum traps. We added in another 324 possum traps and 475 rat and mustelid traps, targeting blocks that were prime possum real-estate. The northern suburbs were smothered in red (trap station dots) on our Trap.NZ map.
Like the year before, we got high catches in newly trapped areas (such as the Hilary St block in Pine Hill that flanks SH1) and started to see catches drop on traps that had been running for a year or more. This is when we started to look closely at our monitoring data to see if our traps had really removed all of the pests or whether they were just losing interest!
Our wax-tag and tracking tunnel data told a mixed story. In some areas, like Signal Hill and Woodhaugh Gardens, we were continuously getting low tracking results. This meant we could reduce our trap density on these lines and trap check frequency. In other areas, we continued to get moderate-high rat and possum detections. At the end of 2022, we started to move our traps around and introduce new trap types to try and entice any pests in the area that may have not been interested in the older traps.
Traps:
644 possum traps
905 rat and mustelid traps
Catches:
416 possums
411 rats
Possum catches 2022

Possum catches in our northern operating area between January - December 2022.
Rat catches 2022

Rat catches in our northern operating area between January - December 2022.
Trapping smarter, not harder: January 2023 - December 2023
This year saw some final significant habitat blocks on private land being tackled by the team. We also spent a lot of time adjusting reserve trap lines and reviewing private property traps with our check in system. Although we lightened trap density in some areas and removed traps where possums had not been caught for a long time and monitoring was showing no detections, we still added another 257 possum traps and 298 rat/mustelid traps to this management block!
Increased trap line adjustments and new traps (the self-resetting AT220s) in our reserves led to a flurry of catches in areas that had been ‘quiet’, such as sections the Botanic Garden, Brackens View, Ross Creek and Prospect Bank.
Traps:
901 possum traps
1203 rat traps
Catches:
406 possums
470 rats
Possum catches 2023

Possum catches in our northern operating area between January - December 2023.
Rat catches 2023

Rat catches in our northern operating area between January - December 2023.
Adding it all together: 2020 - 2023
A whopping 1085 rats and 1352 possums have been removed from the northern block since 2020. That’s 34% of the total project catches for possums and 29% of the total project catches for rats! There are some clear trends with our catch data over time – one thing that stands out is the peak in catch rates for possums between May-September. This is a time in the possum life cycle when females have young joeys and food sources are not as plentiful.
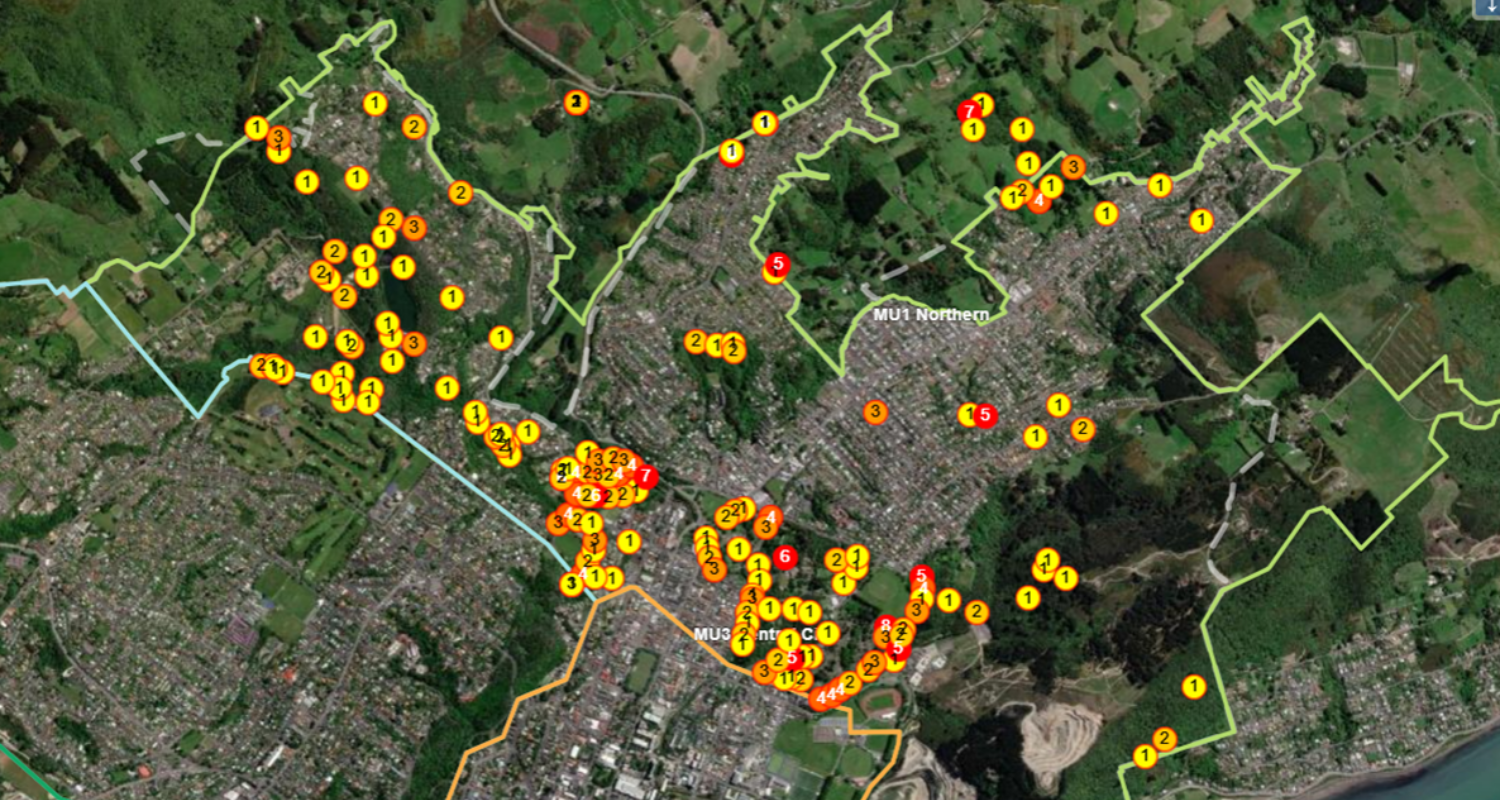
Possum catches 2020 - 2023
Total possum catches from our northern operating area between 2020 - 2023.
Rat catches 2020 - 2023

Total rat catches from our northern operating area between 2020 - 2023.